← Back to homepage

Strategy in action.
Results with context.

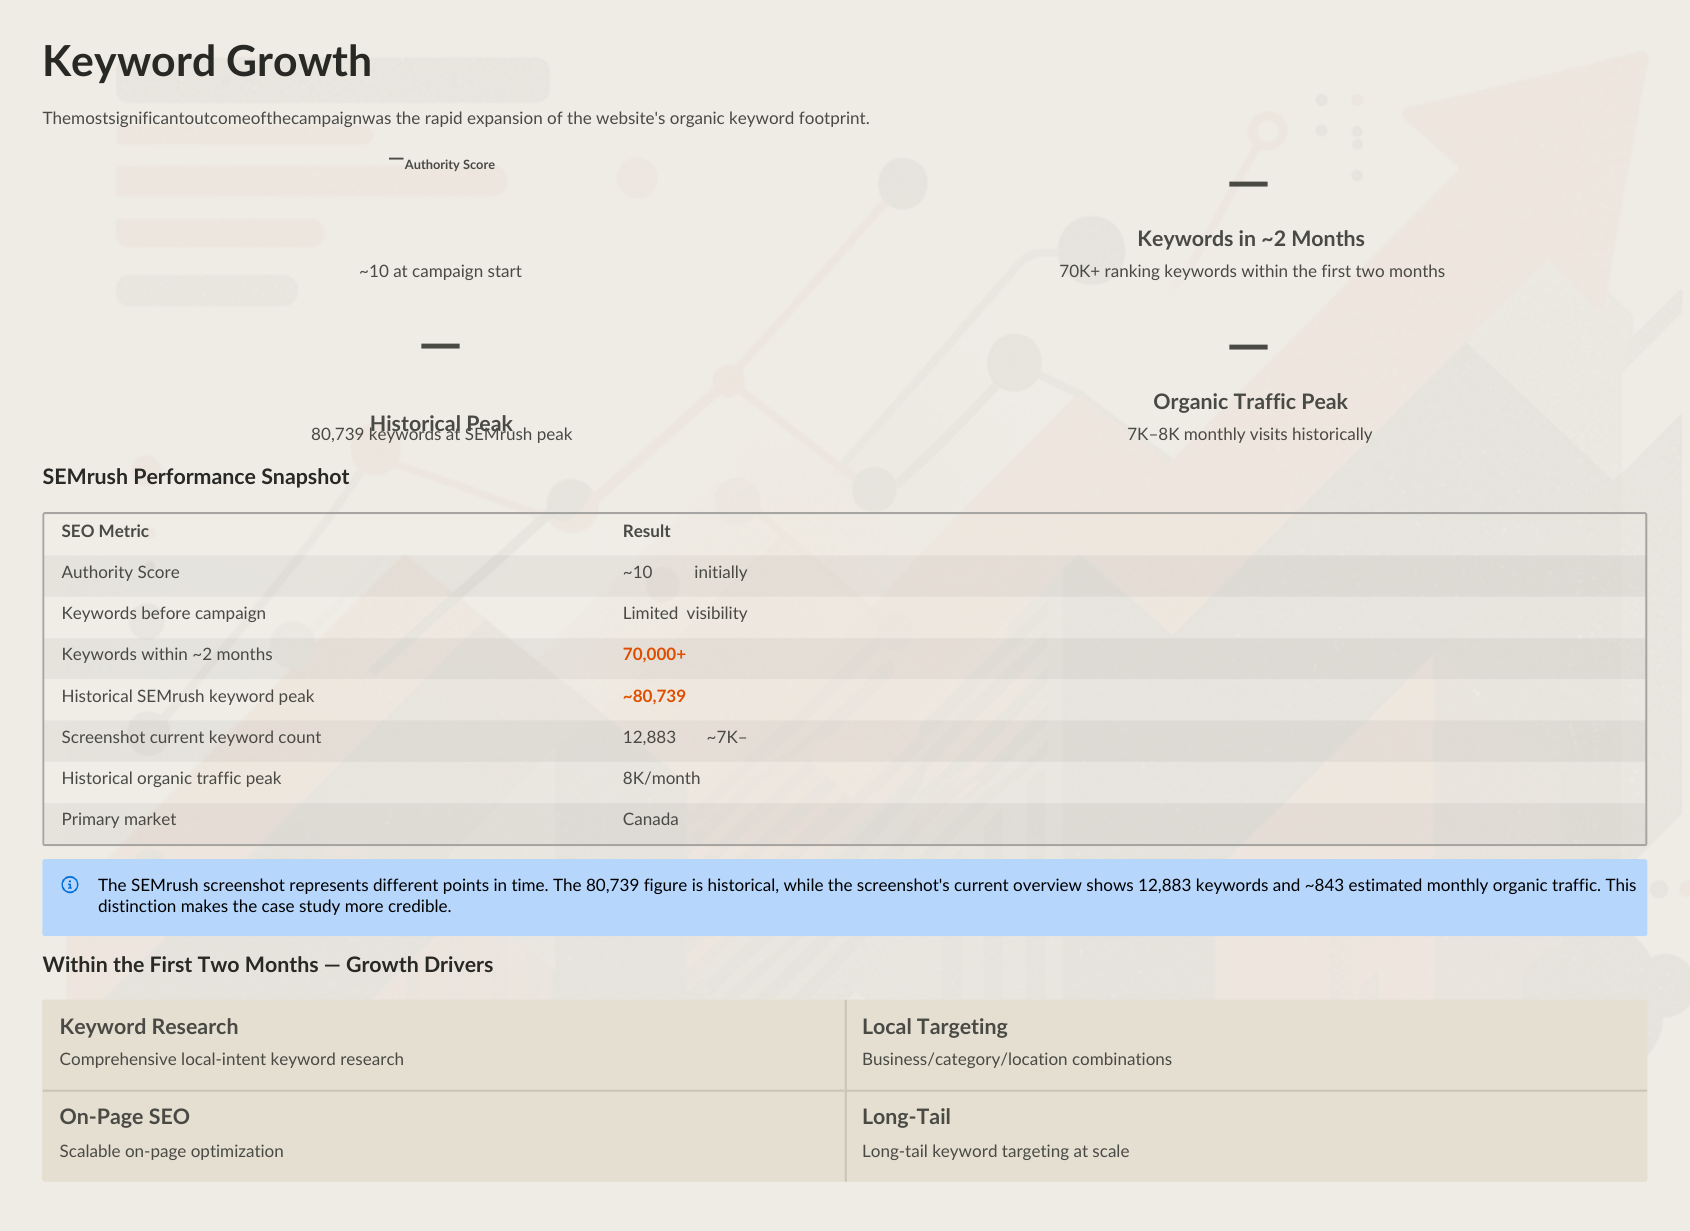
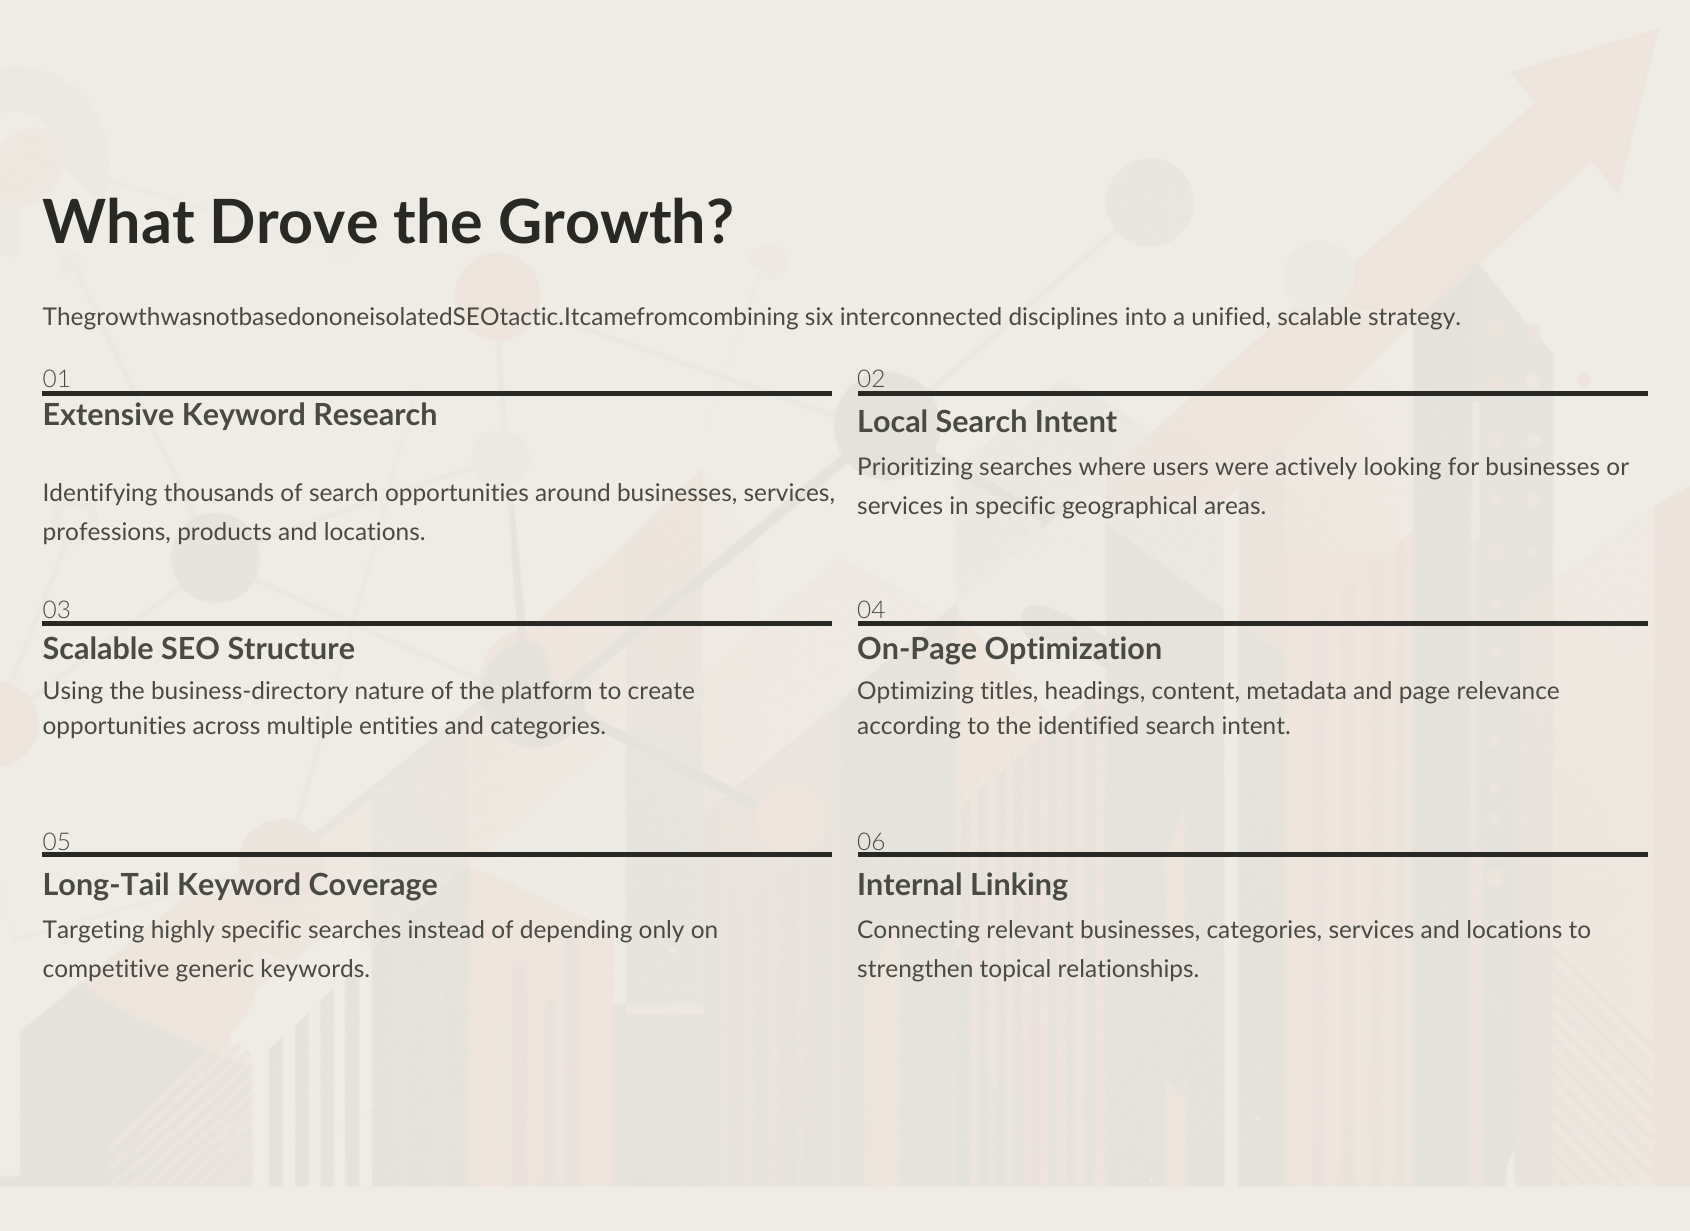
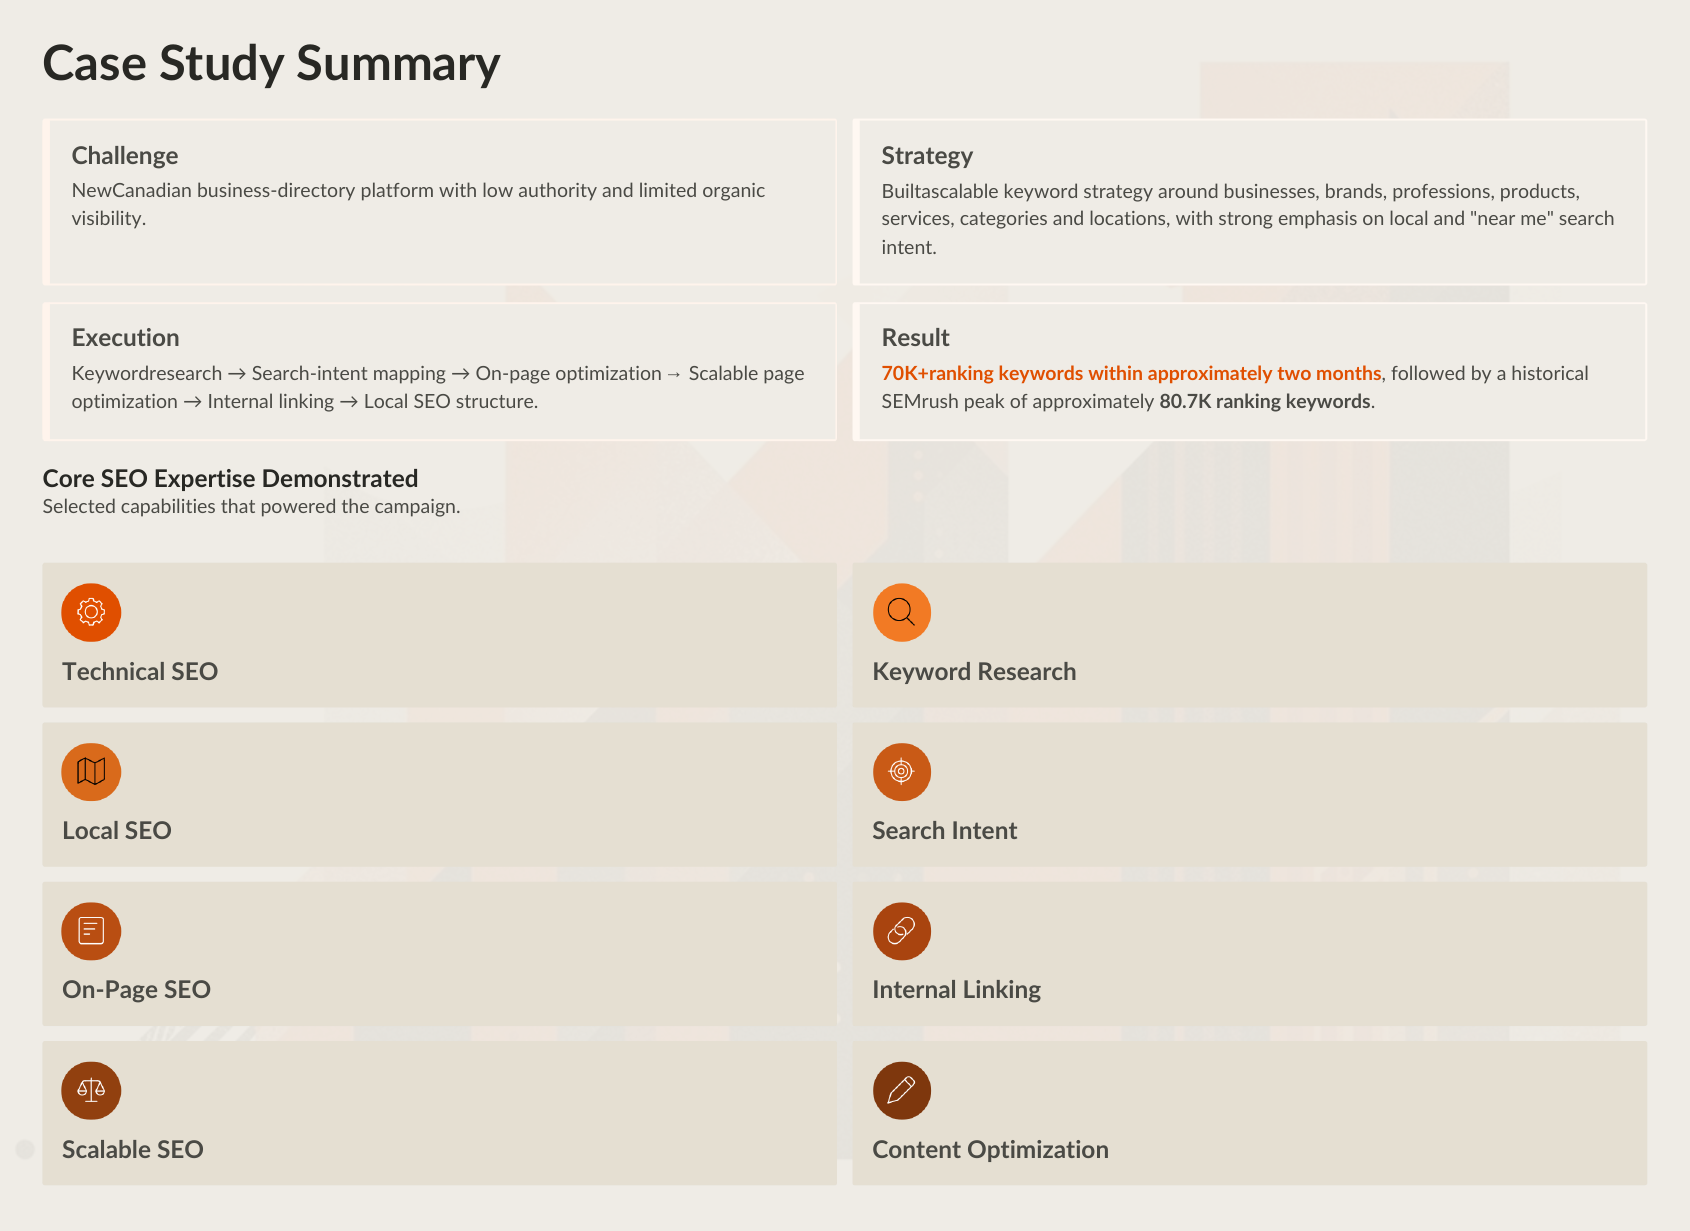
Selected SEO, social media marketing and PPC work across eCommerce, local lead generation and local listings. Client identities are withheld; this page uses only broad industry, platform and country/region labels.

SEOSocial MediaGoogle AdsMeta AdseCommerceLead GenerationUS · UK · Canada · AU/NZ

Real reporting snapshots.
Clear reporting periods.

Metrics below are transcribed from the supplied platform screenshots. Reporting windows, currencies and campaign objectives differ by project. Results are historical and do not guarantee future performance.

META ADS · ECOMMERCEUnited States

Purchase-focused paid social

A pair of account snapshots shows sustained purchase value across the December 2024 and first half of January 2025 reporting periods.

1–31 DEC 2024
5.15x ROAS
Purchases
45
Spend
US$2,382.37
Purchase value
US$12,269.82
1–15 JAN 2025
4.65x ROAS
Purchases
65
Spend
US$2,988.97
Purchase value
US$13,908.15
GOOGLE ADS · ECOMMERCEUnited Kingdom

Shopping and Performance Max account performance

The December 2024 account snapshot shows purchase-oriented conversion activity and attributed conversion value across the account.

3.85xReported ROAS · Dec 2024
Conversions
191.03
Spend
£8,335.53
Cost / conversion
£43.63
Conversion value
£32,089.96
Reporting period: 1–31 December 2024
GOOGLE ADS · LOCAL LEADSUnited States

Plumbing services lead generation

Search activity supported a multi-service plumbing business covering drain cleaning, water heater installation and repair, leak detection, commercial plumbing, emergency plumbing, kitchen plumbing and bathroom renovation.

83Reported conversions · 1–16 Jan 2025
Spend
US$719.01
Cost / conversion
US$8.66
Clicks
343
Impressions
1,863
CTR
18.41%
Average CPC
US$2.10
Reporting period: 1–16 January 2025
META ADS · ECOMMERCEUnited Kingdom

Multi-campaign shopping performance

The source screenshots show 23 campaigns in the January reporting snapshot and a separate December account view.

1–31 DEC 2024
9.07x Average ROAS
Spend
US$2,337.51
Purchase value
US$21,210.17
1–16 JAN 2025 · 23 CAMPAIGNS
5.64x Average ROAS
Spend
US$2,214.52
Purchase value
US$12,494.83
META ADS · ECOMMERCEAustralia & New Zealand

Campaign-level purchase ROAS examples

The supplied work sample lists a monthly budget of US$5,000 for an AU/NZ project. In the December 2024 campaign table, selected campaigns show purchase ROAS values ranging from 5.96x to 44.33x.

MONTHLY BUDGET IN SOURCEUS$5,000
SELECTED CAMPAIGN ROAS RANGE5.96x–44.33x
REPORTING PERIODDEC 2024

These are selected campaign-level values from the source table, not an account-wide blended ROAS.

About these work samples

All client identities are withheld. No client website URLs, company or brand names, logos, account names, or campaign display names are published. The metrics are historical snapshots from the supplied Google Ads, Meta Ads and SEO case-study reports. Paid media definitions and attribution settings may differ by platform and account; organic keyword counts and traffic are third-party tool estimates and may change. The figures are not a promise or guarantee of future results. Client identities and identifiable account details are omitted.

Let's talk about
your growth goals.

Discuss your campaigns ↗
WhatsApp us